of debt
global prosperity
Why it matters?
Public debt can be vital for development. Governments use it to finance their expenditures, to protect and invest in their people, and to pave their way to a better future.
However, it can also be a heavy burden, when public debt grows too much or too fast. This is what is happening today across the developing world. Public debt has reached colossal levels, largely due to two factors.
-
Financing needs soared with countries’ efforts to fend off the impact of cascading crises on development. These include the COVID-19 pandemic, the cost-of-living crisis, and climate change.
-
An inequal international financial architecture makes developing countries’ access to financing inadequate and expensive.
The weight of debt drags down development. Debt has been translating into a substantial burden for developing countries due to limited access to financing, rising borrowing costs, currency devaluations and sluggish growth. These factors compromise their ability to react to emergencies, tackle climate change and invest in their people and their future.
Countries are facing the impossible choice of servicing their debt or serving their people. Today, 3.3 billion people live in countries that spend more on interest payments than on education or health. A world of debt disrupts prosperity for people and the planet.
This must change.
The United Nations has a road map of multilateral actions to address the global debt burden and achieve sustainable development. The roadmap is laid out in Our Common Agenda Policy Brief on Reforms to the International Financial Architecture and the SDG Stimulus, which focuses on three areas of action:
-
tackling the high cost of debt and rising risks of debt distress,
-
massively scaling up affordable long-term financing for development, and
-
expanding contingency financing to countries in need.
The implementation of these actions is crucial to unleash the resources needed to build a more prosperous, inclusive, and sustainable world.

Global public debt at unprecedented levels
1This document follows the developing countries classification of the United Nations M49 system, subject to data availability.
Public debt has increased more than fivefold since 2000
Global public debt (USD trillion)
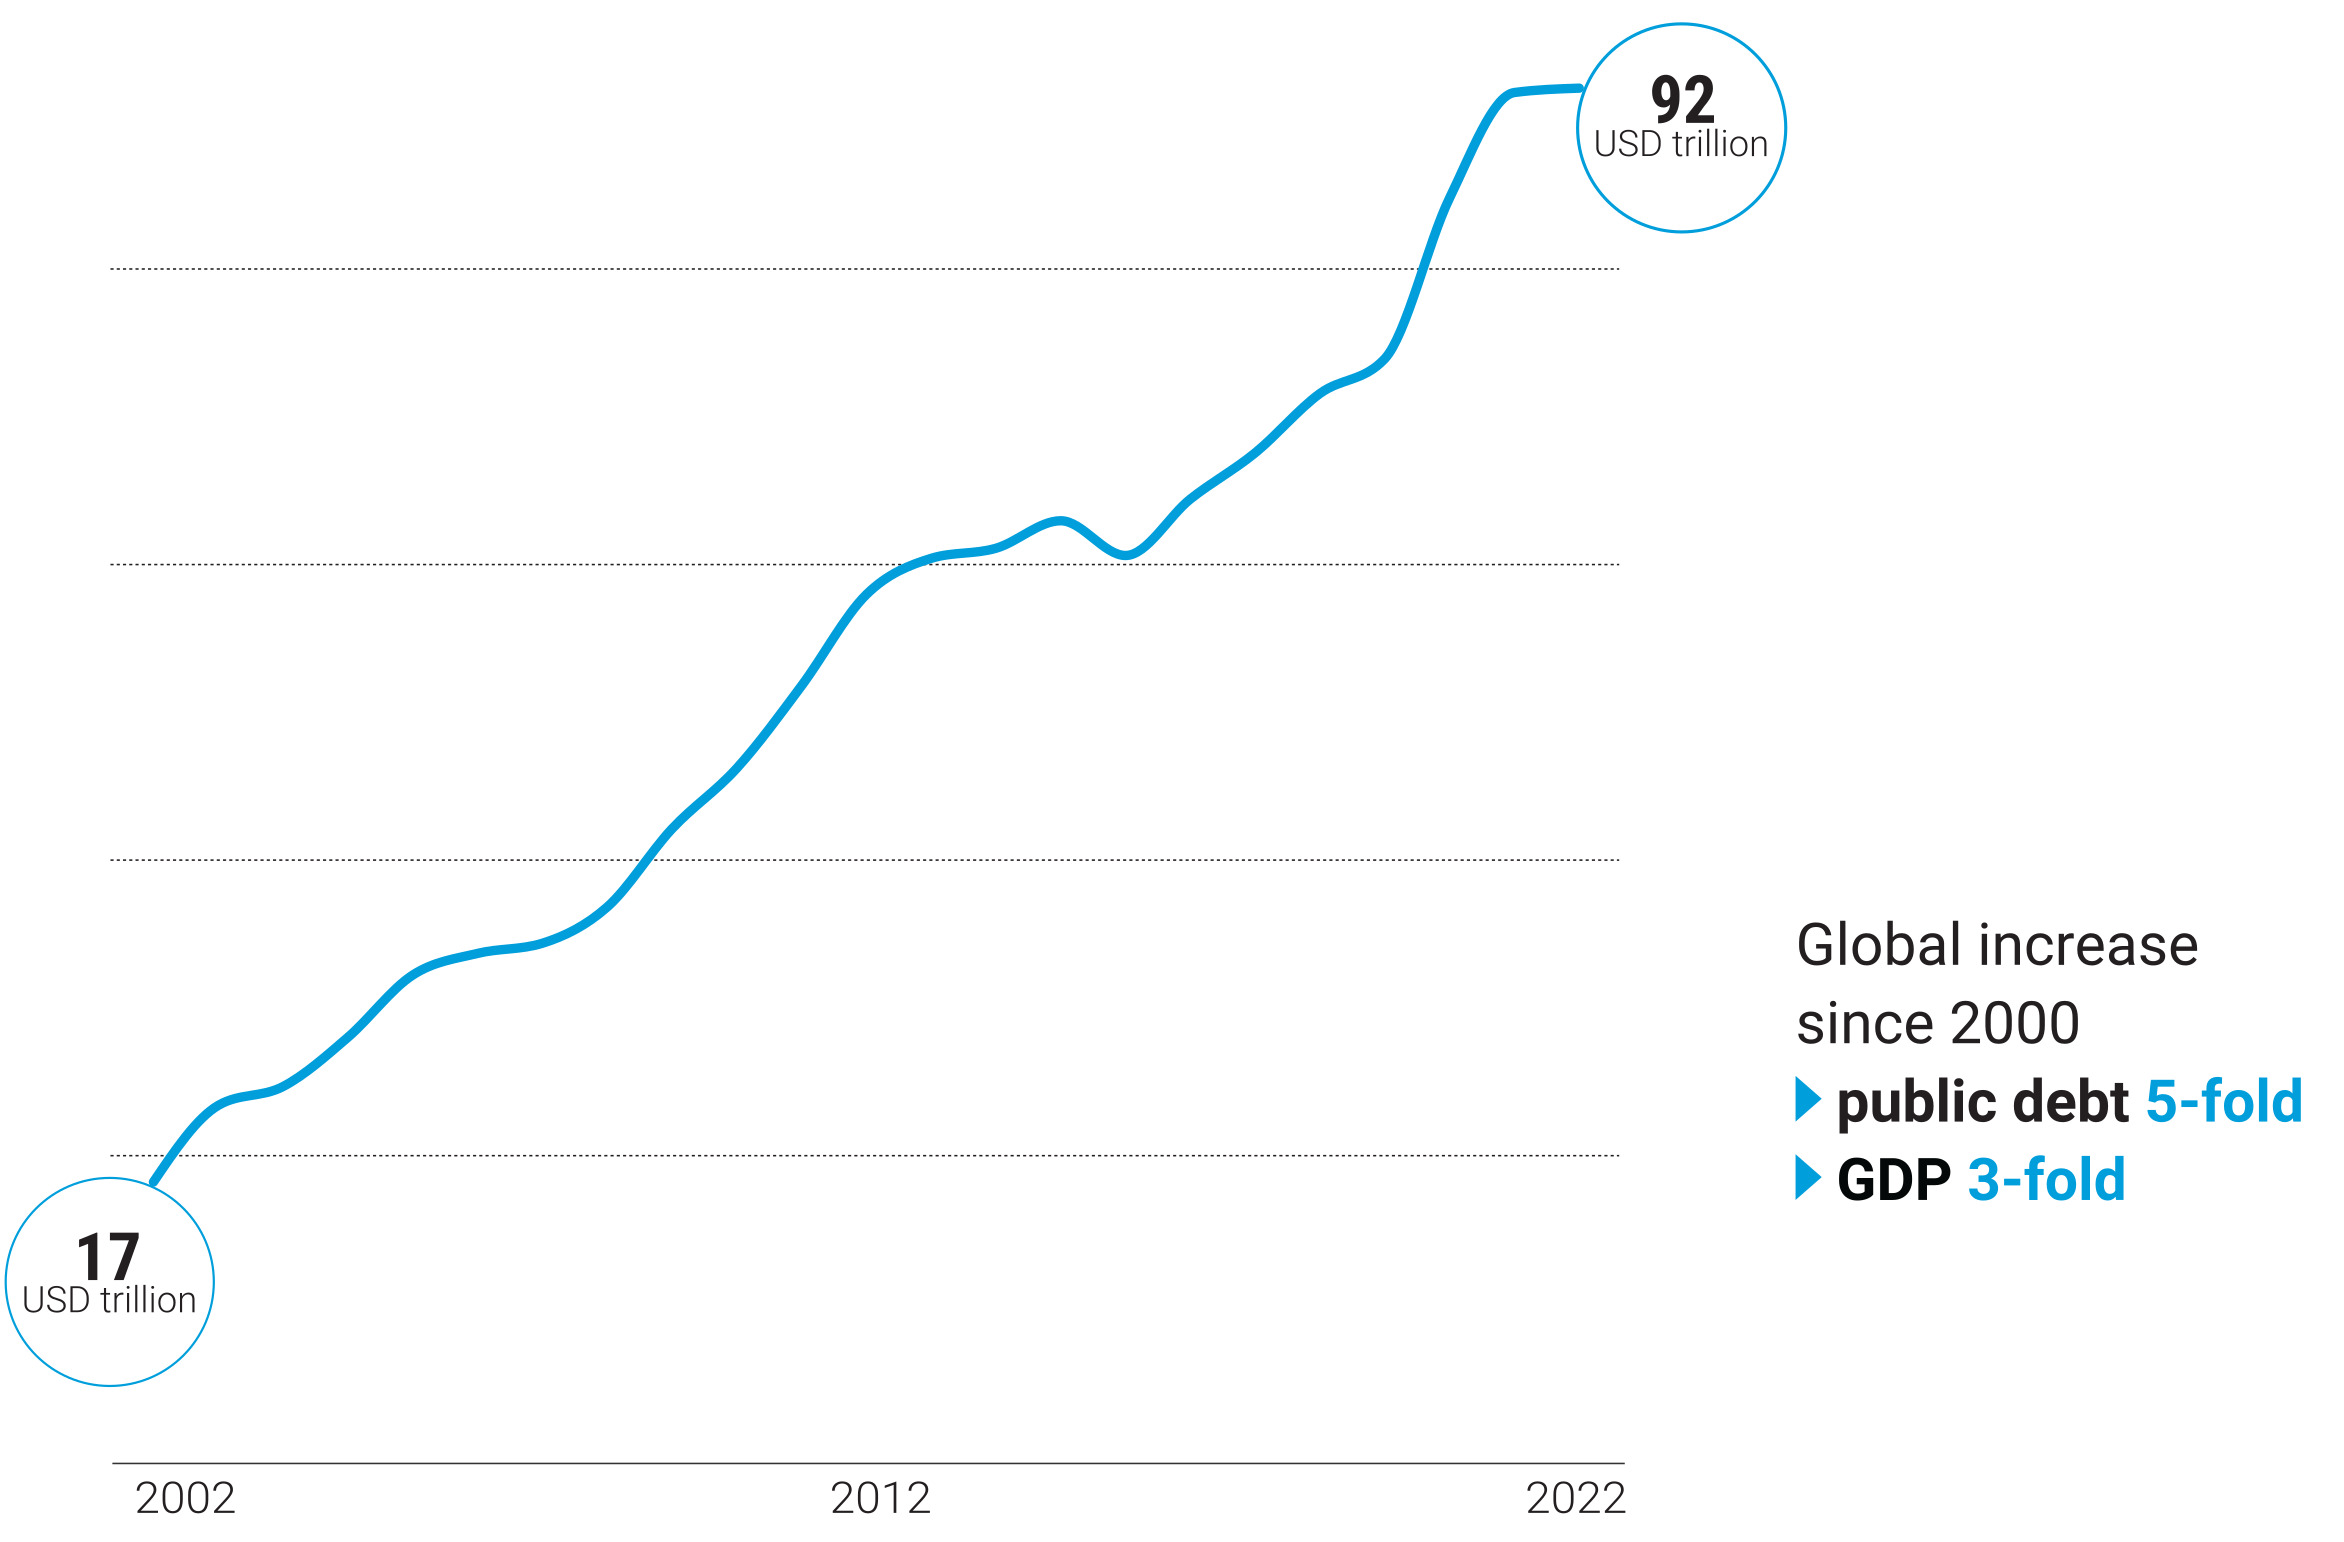
Note: Figures represent nominal values in current USD. Public debt refers to general government domestic and external debt throughout the document. General government consists of central, state and local governments and the social security funds controlled by these units.
Source: UN Global Crisis Response Group calculations based on IMF World Economic Outlook (April 2023).
2A representative threshold of a public debt to GDP ratio of 60% is used to indicate high debt levels. This benchmark is used by the IMF as one of its indicators to assess debt burdens in emerging markets. However, the actual burden posed by debt differs across countries due to factors such as their level of development, growth and revenue potential, as well as institutional considerations.
Almost 30% of global public debt is owed by developing countries
Public debt by country in 2022 (USD billion)
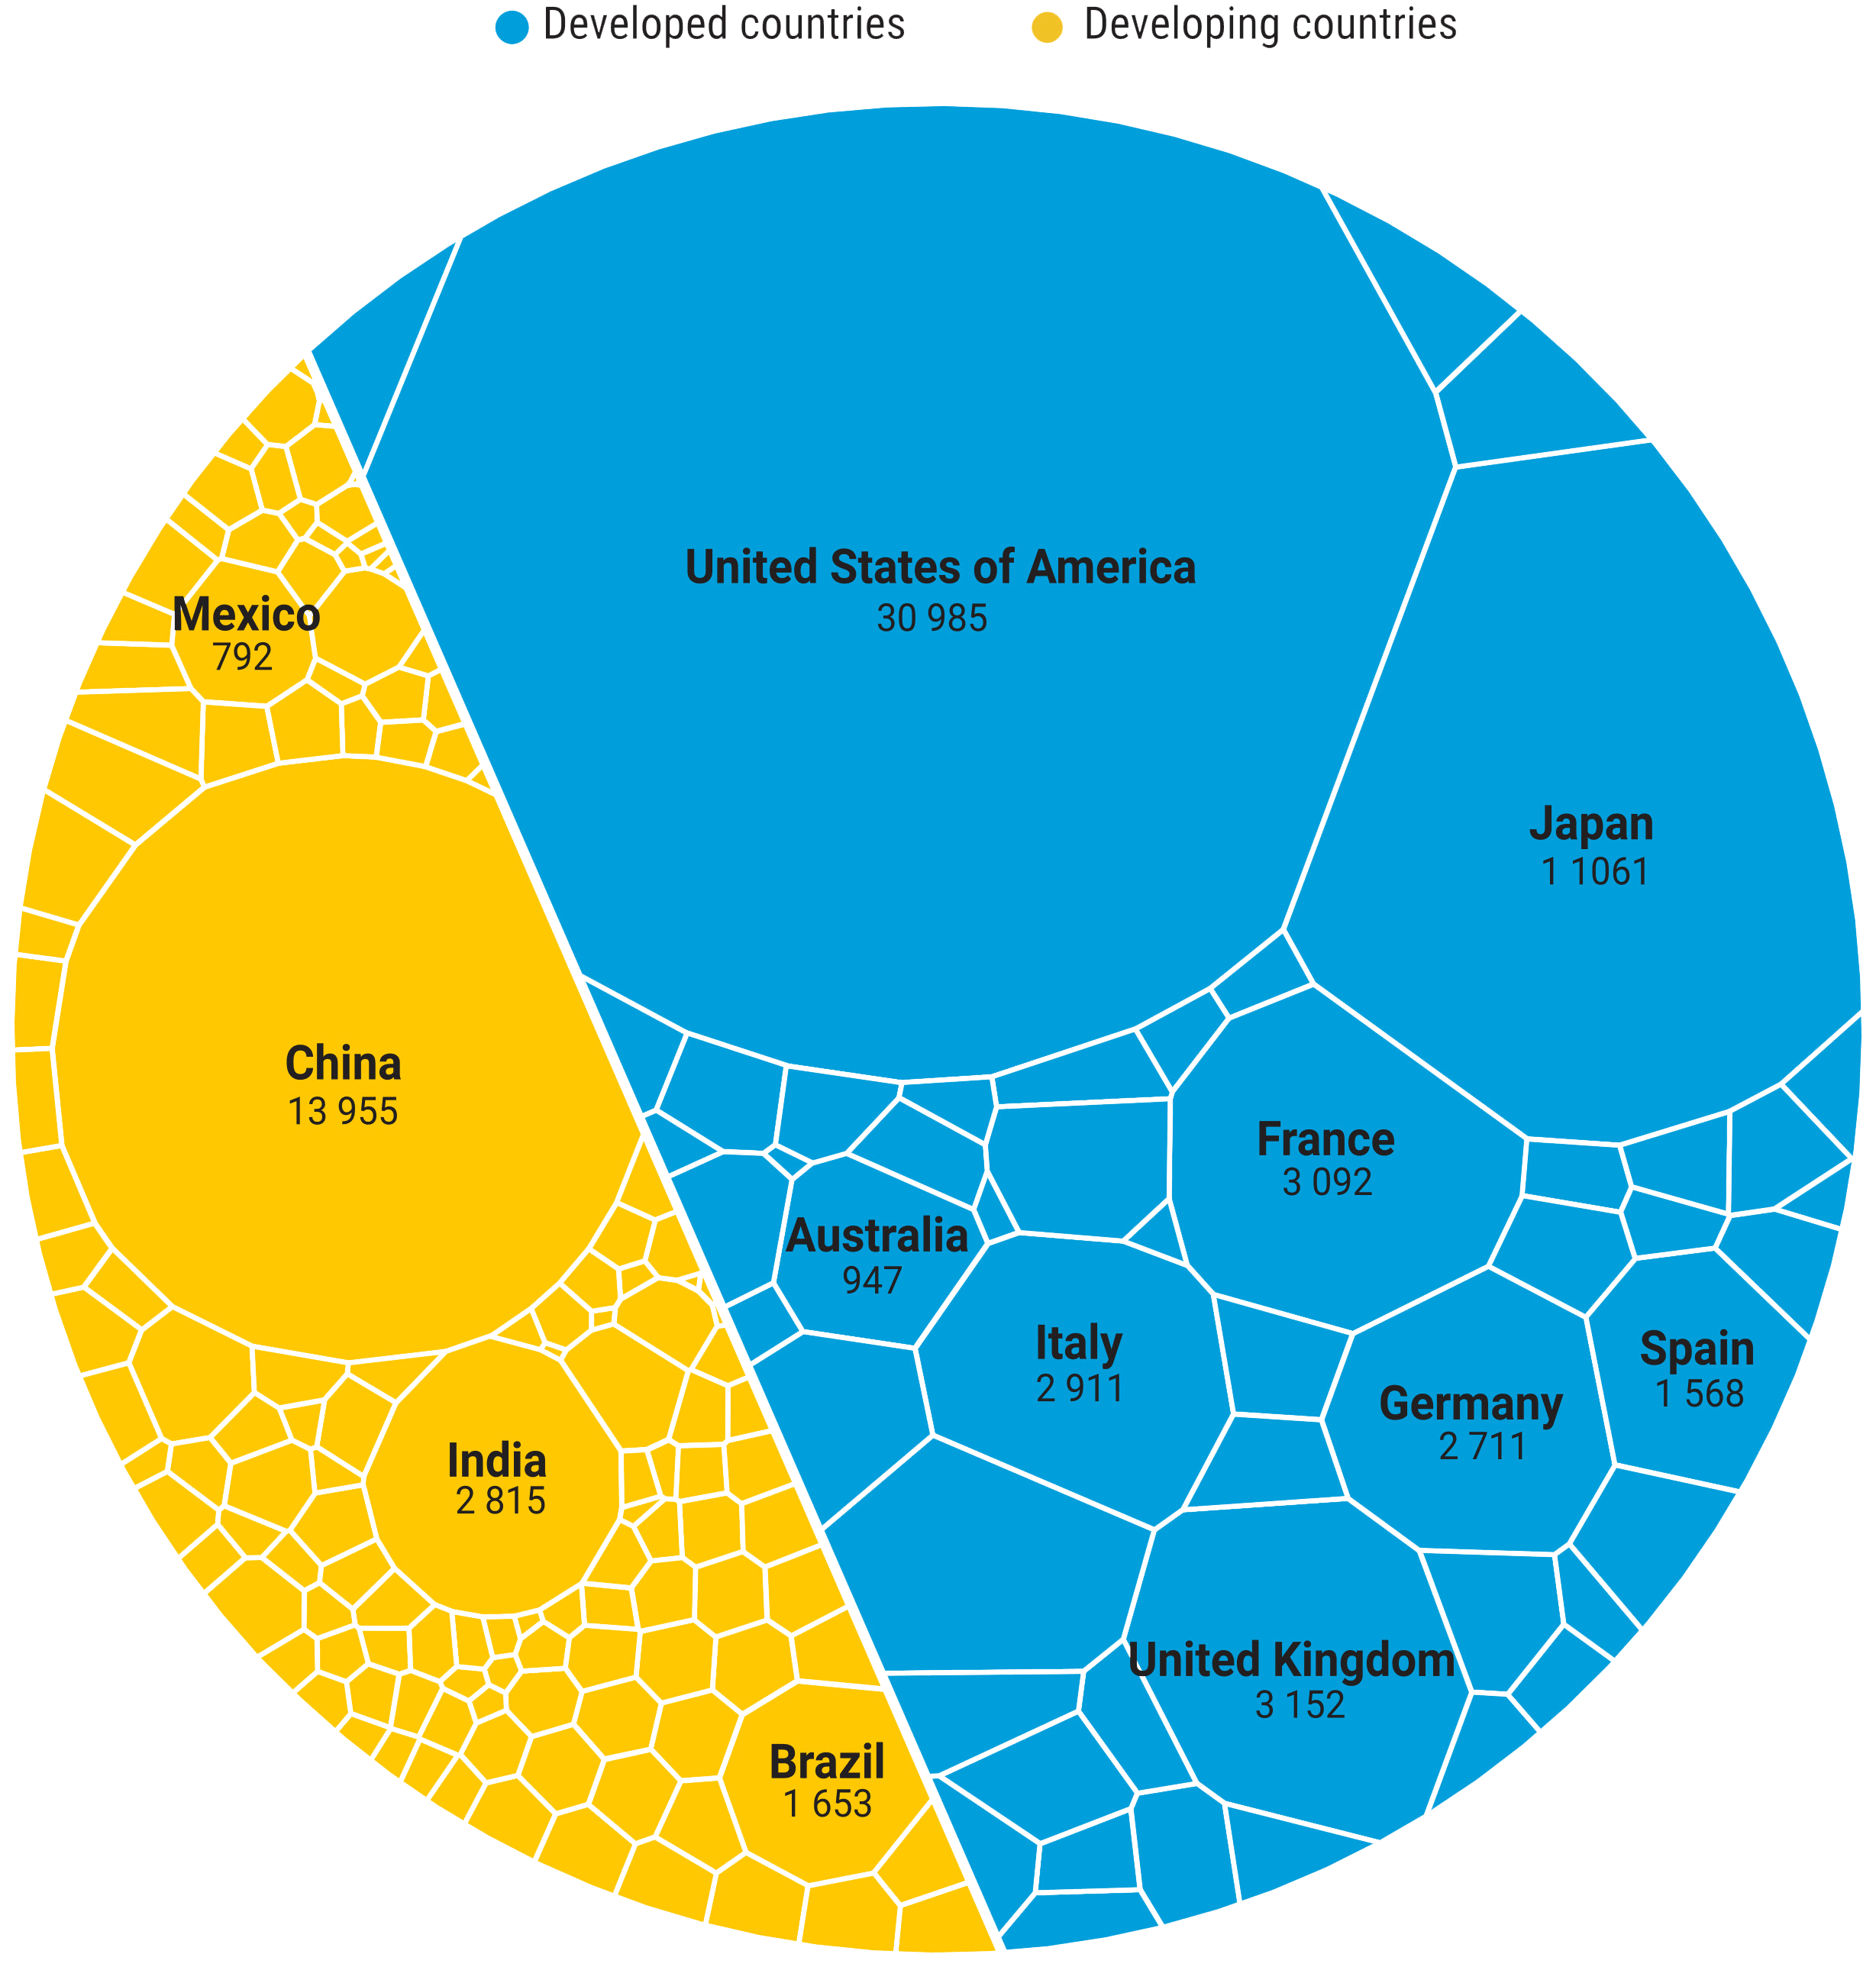
Source: UN Global Crisis Response Group calculations based on IMF World Economic Outlook (April 2023).

Inequalities in the international financial architecture
Developing countries are dealing with an international financial architecture that exacerbates the negative impact of cascading crises on sustainable development. The burden of debt on development is intensified by a system that constrains developing countries access to development finance and pushes them to borrow from more expensive sources, increasing their vulnerabilities and making it even harder to resolve debt crises.
3For comparison, the 1953 London Agreement on Germany’s war debt limited the amount of export revenues that could be spent on external debt servicing (public and private) to 5% to avoid undermining the recovery.
Developing countries rely more on private creditors now, making credit more expensive and debt restructuring more complex

Note: External Public and Publicily Guaranteed (PPG) debt.
Source: UNCTAD secretariat. Calculations based on World Bank International Debt Report 2022.
Developing countries pay much more for their borrowing
Bond yields (2022-2023)

Note: Illustrative comparison of the average JPM EMBI Global Diversified USD bond yields per region with the 10-year bond yields of Germany, and the United States from January 2022 to May 2023.
Source: UN Global Crisis Response Group calculations based on IMF World Economic Outlook (April 2023).

Facing impossible choices:
servicing debt or serving their people
The rise of interest payments is a widespread problem. The number of countries where interest spending represents 10% or more of public revenues increased from 29 in 2010 to 55 in 2020.
4Unless noted, interest payments in this section refer to net interest payments of the general government. This is the total amount of domestic and external interest expenses incurred from borrowing, minus any interest income received.
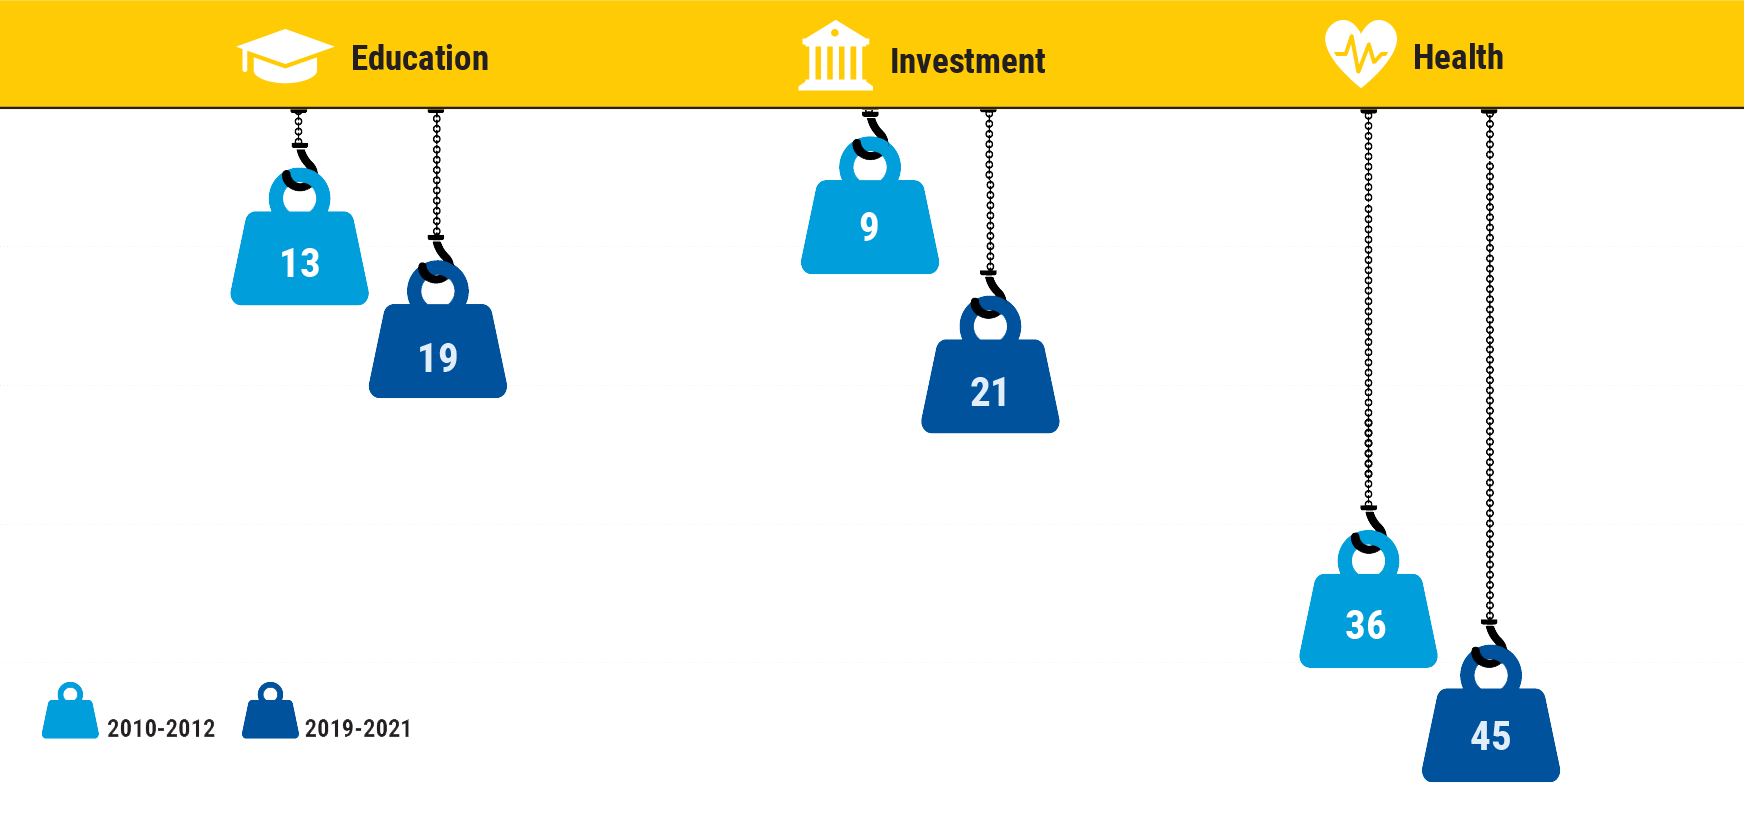
Interest payments are growing faster than other public expenditures
Nominal change (%) of public expenditure categories in developing countries between 2010-2012 and 2019-2021
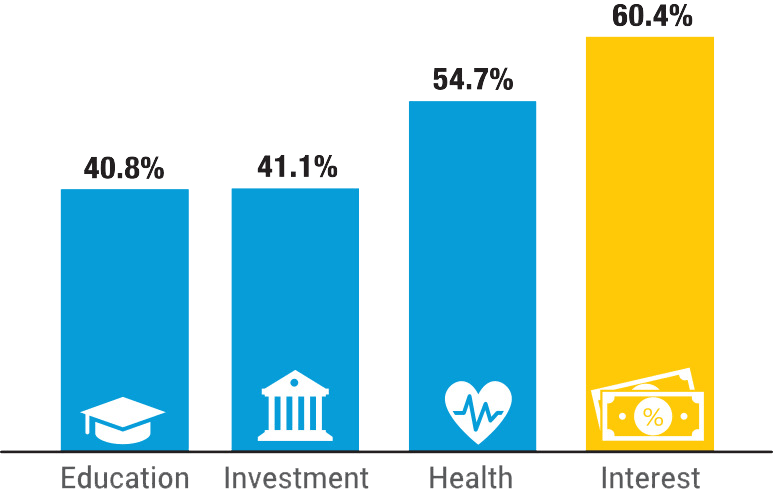
Note: Aggregate expenditures for developing countries.
Source: UN Global Crisis Response Group calculations based on IMF World Economic Outlook (April 2023), IMF Investment and capital stock database and World Bank World Development Indicators database.

People pay the price
Some regions spend more on servicing debt than serving their people
Public expenditure on net interest, education, health and investment as a share of GDP (%) (2019-2021)

Source: UN Global Crisis Response Group calculations based on IMF World Economic Outlook (April 2023), IMF Investment and capital stock database and World Bank World Development Indicators database.
Interest payments outweigh development spending in more countries
Number of developing countries spending more public resources on net interest than on education, investment or health
Source: UN Global Crisis Response Group calculations based on IMF World Economic Outlook (April 2023), IMF Investment and capital stock database and World Bank World Development Indicators database.
3.3 billion people live in countries that spend more on interest than health or education
Population of developing countries spending more on interest than health or education

Source: UN Global Crisis Response Group calculations based on IMF World Economic Outlook (April 2023), IMF Investment and capital stock database and World Bank World Development Indicators database. Latest figures available.

A roadmap to finance sustainable development
To address the global debt challenges and achieve sustainable development, the United Nations in the SDG Stimulus package and the Summit for the Future’s International Financial Architecture policy brief outlines a clear way forward

Inequality
is embedded
in the international
financial architecture.
This must change.